
This document serves as a guide to understanding the calibration report that can be generated after calibration. On completion of the calibration process outlined in the The NEON ‘Your Reference’ Color Management release, you are presented with an option to ‘Save Report’. The report contains details of the calibration results for your NEON monitor. Make sure you click on 'Save Report' when presented with this option, to generate and save the report to your computer. Please also share the report with us at the following email address: neon@atomos.com
The following information will help you to understand the results of the report.
Calibrating your NEON monitor
The image you view on the NEON monitor screen is not digital. It is an analogue conversion of the digital image, and this chemical process is subject to fluctuations in performance. This is the main reason for calibrating a monitor to make sure the image on the screen is an accurate representation of the digital file.
After calibration of your NEON, the adjustments made during calibration will set the monitor up to be within the parameters set by the industry specifications from organisations like, for example, ITU, SMPTE and others. These define the colour spaces that are used across the moving image production industry and the tolerances that are acceptable in real production use.
The Atomos Calibrator Report

The measurement used for the tolerance is known as delta E 2000, and it represents the difference between two colours as a number. Our objective is to have the monitor colours under a dE2000 of less than 2.3. That is not always possible, and not meeting the target is not an indication that the screen is a failure.
Many factors can affect the measurements. If the report shows measurements over the dE2000 2.3 value, the monitor could still be acceptable to work with. It might also pass if the environmental conditions during calibration are changed.
For example, you should calibrate your NEON after it has been powered on with pictures on the screen for at least 30 minutes before you begin the calibration. Calibration should also be performed in a dark environment, at a temperature between 22˚C to 25˚C. Also, the calibration meter needs to have been stored in a cool, dry place and not in direct sunlight or bumped as it contains filters that can be affected by the environment.
Hardware and Software Details section
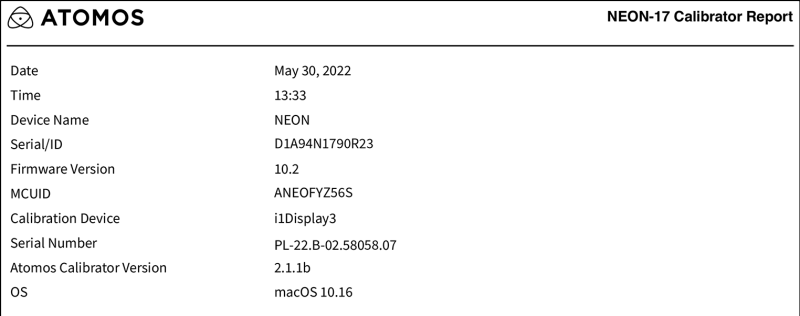
The top of the report provides details on the monitor that has been measured and calibrated. In the case of the NEON, that also includes the Master Control Unit (MCU). The model of the measurement meter and it’s serial number are also recorded. These details are important for the comparison of results, since different meters have different profiles. The last field details the operating system used.
Color Space
The rest of the report details the target color space and what the monitor managed to achieve. The colour space is defined essentially by the following sets of parameters:
-
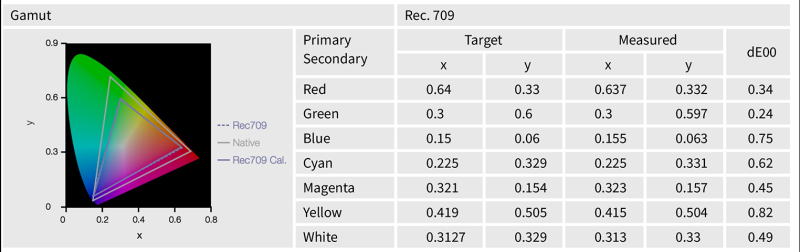
Gamut is the amount of color the monitor can display and might be described as saturation or hue. Three measurements define the triangle, with the primaries Red, Green and Blue on the corners and the secondaries Yellow, Cyan, and Magenta along each line.
-
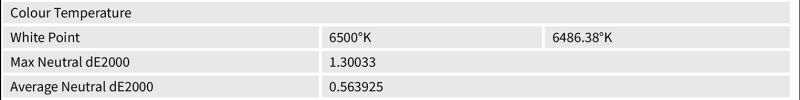
The white point is where the neutral tones are balanced between Red, Green and Blue. It is also referred to as the color temperature, measured in degrees Kelvin from the black body curve, which is related to temperature.
-
Luminance is the range of illumination the color space is defined to use from the peak white value to how low the minimum luminance is. It is measured in Candelas per meter squared (cdm2), more commonly called nits.
-
Gamma or EOTF (Electronic to the Optical Transfer Function). This is how all the different tones of color appear on the screen looking the way we expect. Our eyes don't see the same way a screen displays color, so it is adjusted to show the tones at a luminance that makes sense to our perception.
For each of the above, there are measured values and charts to show how close the monitor is to the desired color space.
Gamut
The gamut chart on the left shows the measured results against the target triangle, whilst the table on the right shows the dE 2000 values for the primaries and secondaries.
White Point
The White point or colour temperature is reported as the value in degrees Kelvin and also the x & y coordinates in the gamut chart and the delta E 2000 value.
Luminance
The luminance is reported as the minimum and maximum luminance.

EOTF (Electronic to Optical Transfer Function)
The EOTF (Electronic to Optical Transfer Function) chart shows the comparison between the measured and target curve that ensures the image appears how we expect it to look.

Gray Balance Chart
The Gray Balance chart displays the accuracy of neutral tone reproduction. This is a measure of whether the color temperature is correctly displayed from the dark tones through to peak white. A single line would be the ideal balance of red, green and blue, producing the required neutral gray.

Calibrate your NEON regularly
As you calibrate the monitor over time, you will begin to see these values change. This is normal as the materials do degrade over time. However, regular calibration will keep the monitor as close to the target as possible.
Comments
0 comments
Please sign in to leave a comment.